
Technical Analysis 101 - Part 2
Salamunalaikum..
Friends.. welcome to Technical Analysis 101 - Part 2.. yeah.. nobody ever mentioned that we have Technical Analysis 101 - Part 2... even I , myself; surprised by this Part 2 whole thing... :P
Nevertheless, I just would like to show you just how a Technical Analysis will look like...
Roughly, the analysis will look something like this... (refer the picture below)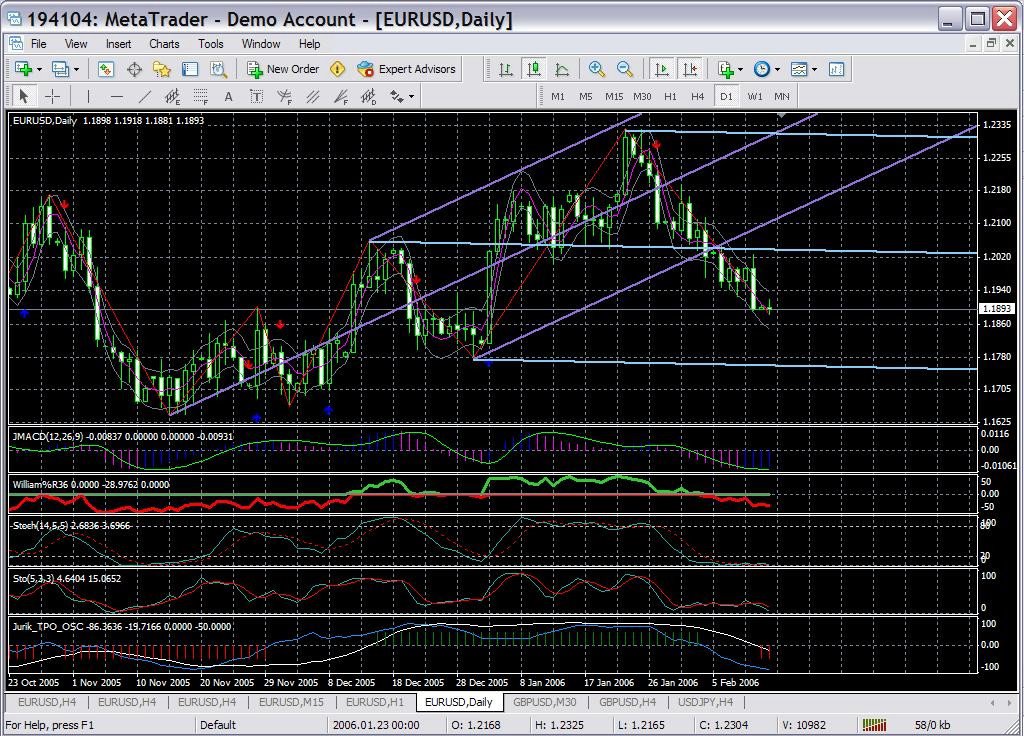
Ok the picture shown above is what we call a chart.. in my case, I'm using this awesome free charting tool from Metaquotes Software called MetaTrader 4 to achieve the above drawing.
So, on this Metatrader tool, you would open a chart ( of your preferred currency pair ) and throw a number of indicators (RSI, MACD, Stochastic, Williams R%), MA lines, pivot lines (hey.. I did tell you to do your readings right?) , chant some mantra and like a soothsayers try to predict which way the market will go.
Got it? All right, ignore that mantra thingie and soothsayers premonition part.. but what we want to achieve in the end of the day is from the indicators and other things laid out on the chart we will get rough idea or at least some hints of the market condition and plan our trades accordingly...
How to read the indicators you ask? Hehehe.. back to the library guys...happy reading...
p/s: I think e/u will rise... what u think ?
and I hear someone says.. this myswissbank guy is crap... :P

0 Comments
Post a Comment